Using Weather Stations to Study Kīlauea’s Dec 20, 2020 Plume: USGS Volcano Watch
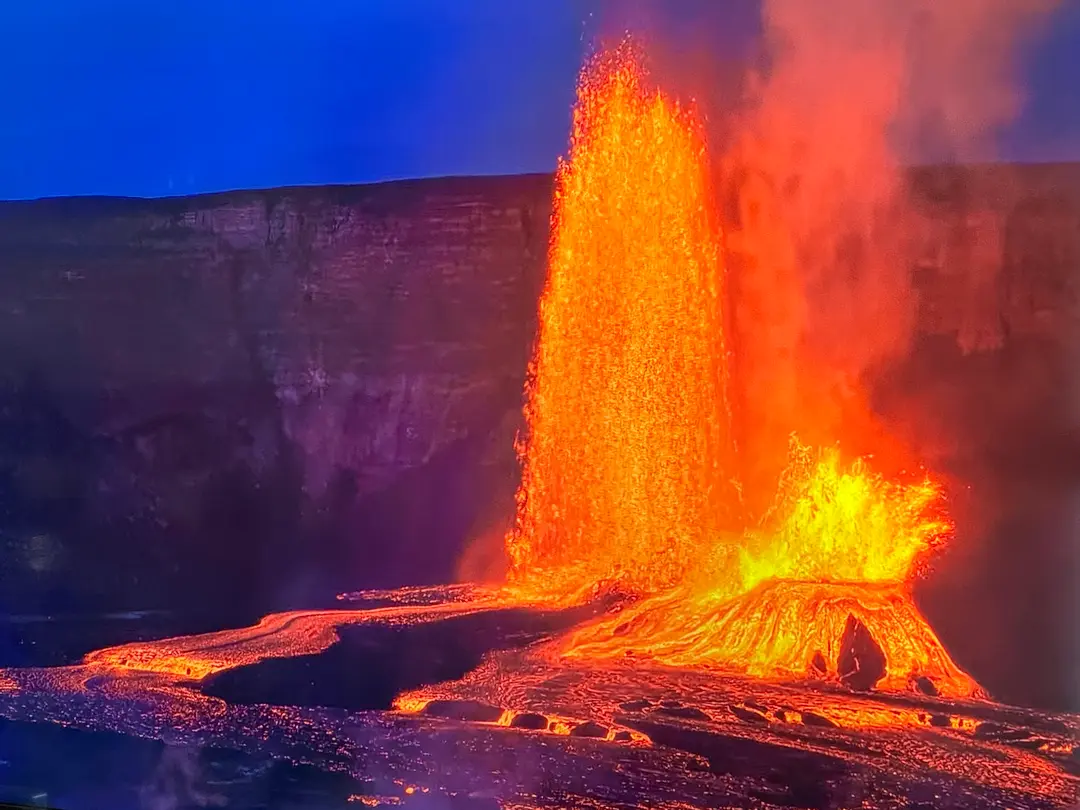
This week marks the second anniversary of the appearance of water in Kīlauea’s Halema‘uma‘u crater, so it seems timely to discuss the water lake’s demise last December 20, or rather, its transformation into a volcanic plume and how we use weather radar to investigate how that happened. The word ‘radar’ recalls images of a meteorologist forecasting weather, or aircraft blips on a green radar display, as frequently portrayed in the movies. RADAR is an acronym for Radio Detection And Ranging, a tool that has been broadly used since its conception in the early 1900s. Today, radar has many uses: in the atmosphere to track weather systems and aviation activity, in space to image the Earth and extraterrestrial bodies from satellites, and even in the ground to detect buried objects. Volcanologists currently use several different types of radar to study volcanic activity. Radar operation uses an antenna that focuses pulses of energy as it scans specific directions and angles. The pulses travel at the speed of light and intersect objects in their path, such as mountains, buildings, airplanes, birds, raindrops, or volcanic ash. As a pulse hits an object, a fraction of its energy is reflected toward the antenna. The reflected energy is then measured and processed to give values of “reflectivity.” Reflectivity is most sensitive to an object’s size and shape, though since a pulse can interact with many objects simultaneously (for example, droplets in a cloud), the concentration of objects is also important. Radar antennas can scan 360 degrees around a station at various elevation angles and produce nearly complete atmospheric coverage within 100 or more miles in just a few minutes. This is how meteorologists present nearly continuous coverage of weather systems worldwide. Weather radar is also an extremely important tool for studying explosive eruptions. Radar pulses reflecting off suspended ash, water droplets, or ice crystals in volcanic plumes provide insight into the plume’s composition and 3D structure. Doppler radar systems used to measure wind speed can also measure turbulence structures in plumes which allows us to track how they capture air, grow in size, and rise through the atmosphere. Using tens of scans per hour, we can measure plume and eruption evolution in time. This can aid in hazard assessment and eruption interpretation. The Island of Hawai‘i hosts two WSR-88D radar stations, at South Point (PHWA) and Kohala (PHKM). The December 20, 2020, eruption plume was visible to both stations, so their data help understand this interesting eruption. The water lake in Halema‘uma‘u was 50 m (164 ft) deep and growing when Kīlauea summit erupted on December 20th. A new fissure opened above the lake on the crater wall at 9:30 p.m. HST. A large volume of lava spilled down into the lake, boiling the water, and producing a volcanic steam plume. Unlike explosive ash plumes that erupt at high velocities directly from a vent, this plume originated from the boiling water, carried little ash, and began rising immediately but slowly, reaching 13 km (43,000 ft) above sea level at its peak. By 11:00 p.m., HST, the water had vanished, replaced by a growing lava lake. Radar measurements of the plume were accessible minutes after the plume appeared and clearly show its development, increasing height and intensity with the opening of the new fissure, and detachment and decline after the water lake dried. We use standard 2D radar scans to render a 3D plume visualization shown as reflectivity isosurfaces (3D contours). The visualization displays how plume height, structure, and rise/fall rates change through time. It shows that the plume pulsed, likely related to changes in lava effusion rates or lava-water contact area. We can use the radar models to locate areas of interest for sampling deposits from the plume on the ground, and to compare high reflectivity zones with phenomena like lightning to correlate visual observations to internal plume dynamics. Lastly, we can calculate concentration throughout the plume, the path of the plume, and the total ash volume transported and deposited during the eruption. All this from free data! Another advantage of weather radar is accessibility. Many stations provide free publicly available near-real-time data, accessible through the National Oceanic and Atmospheric Administration (NOAA) free Weather and Climate Toolkit software. Anyone interested in the wonders of radar and volcanoes can analyze data from their own computer. Radar is a vital and growing asset in volcanology that will be increasingly useful to the USGS Hawaiian Volcano Observatory in future eruption scenarios. --- Image 1: "December 20, 2020, Kīlauea volcanic plume shown from the Gemini Observatory on Mauna Kea (left) and a 3D radar visualization from the same perspective. The radar reflectivity isosurfaces reveal the plume’s internal and external structure." Image 2: "Example of 2D and 3D radar visualization of the December 20, 2020, Kīlauea volcanic plume. Displayed in photo (top, USGS photo), 2D radar scan from station PHWA (middle, NOAA Weather and Climate Toolkit), and 3D radar visualization (bottom, Google Earth)." IMAGE CREDIT TO USGS-HVO Volcano Watch is a weekly article and activity update written by U.S. Geological Survey Hawaiian Volcano Observatory scientists and affiliates. This week’s article was written by Cascades Volcano Observatory postdoctoral researcher Ryan C. Cahalan.