Help Ken Boyer in His Recovery Journey
Our friend Ken Boyer is facing some pretty serious health challenges right now. Ken was an early friend and contributor to Hawaii Tracker over 8 years ago now. Any support you can give him would be appreciated and please keep him and his ohana in your prayers! 🙏
If anyone would like to support Ken and his family you can do so at the link below.
https://www.gofundme.com/f/liver-transplant-journey-recovery-nsvfc
Here is the post Ken shared on social media today:
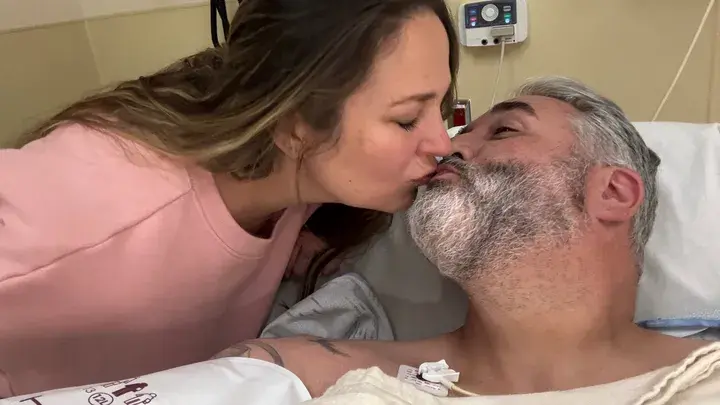
"Hello my dear friends and family, this is gonna be a long one, sorry but I feel it’s time I share my story that very few know. The last few years have been extremely difficult for me and my family. We’ve suffered tremendous loss and I found myself feeling ill also. Very weak, extremely tired and fatigued, abdominal pain, unable to think clearly and at times not even being able to form sentences, unable to remember things, etc…I was very concerned and went to the doctor. After a series of tests and such I was ultimately diagnosed in November of 2023 with End Stage (Stage 4) Liver Disease (Cirrhosis) as well as several other related diagnosis, the worst being Hepatic Encephalopathy. Went to a few doctors to review the diagnosis. One was very hopeful and said may be able to get a transplant. Another said I had 6 months to live and it sure felt like it. Since then I’ve changed my diet, saw many specialists, been back and forth to Oahu and even to California. It is believed that this disease came on from a fall I had into stagnant water on a river back in 2008. At that time I contracted Leptospirosis. That was very difficult to navigate for quite some time but I did get better and I thought that was that. Apparently not…
It’s heavily affected my ability to work. We tried many things attempting to keep Rico’s Taco Shop open but it just wasn’t able to operate successfully without me being present. My wife did an amazing job of trying to keep it going. She was just working herself to death though. She ultimately was able to secure a great job and I have since been unable to find a way to operate Rico’s. This has been crushing to us in so many ways. My dream business, emotionally, financially…. Needless to say, it’s been a roller coaster. This has pushed us to the breaking point in so many ways and continues to daily. The hardest part is what I see it doing to my wife and kids. They are amazing. My wife has been by my side through all of this and I can’t thank her enough for all that she’s done. The kids are affected a lot and it kills me. I don’t have the energy to be there with them and present like I’d like to be. They are strong. They know daddy has some health issues but don’t understand the extent of it. My oldest daughter is aware but living in the mainland at this time.
Unfortunately the cirrhosis has progressed and has made it impossible to do much. A lot of days I’m unable to drive even. There’s been countless trips to the ER and stays in the hospital due to this as well as many procedures and medications. Currently I’m on 12 medications. I will need a transplant to live and I’m working towards that. However I will be having to move to either Oahu or California to do so. I’m working on getting disability but have been denied and have to keep pushing for it. My days consist of falling asleep at all times out of nowhere, even standing up. Or the opposite, extreme insomnia. The day to day of all the symptoms is overwhelming and I won’t bore you with it all. Some are very ugly too, you don’t wanna know lol. The cost of ongoing care has been a huge burden on us as well and we do need help there also, somehow.
I decided I needed to be transparent about this. I owe it to you all. You’ve all been such amazing friends and family that it only seems right. I’m sure some have wondered “what happened to that guy, he used to always be online”. Well, I just can’t be like I used to be. Life has become very mundane.
The last thing I wanted to do was ask for any donations. We’ve been trying to do anything and everything we can to sell off everything to raise funds. We’re just not nearly close enough and currently not able to cover bills even. But my main concern is being able to get to Oahu or California when the time comes for a transplant. Which will happen sometime in the near future. I don’t know any other way to make this a reality. We have a lot of loose ends here that we will have to deal with financially before it’s possible to even leave and once I’m there I’ll need to rent a place to stay. Medical should cover the majority of the medical bills. Depending where I go. If I have to go to California the medical will be different and won’t cover nearly as much. But Oahu doesn’t have nearly as many viable livers annually. So that’s where the concern is as to where I’ll be going.
Either way, no matter what happens, if you donate, it will be going to the ongoing cost of care, travel, housing, and anything else that is going to be out of pocket.
If you can help, that’s fantastic and I appreciate it more than I could ever explain but a share means just as much. Thank you all! I will try to get back with everyone as much as I’m able to. Even a prayer!!!
Love you all 🙏🏼"