Remembering a special event: the 2011 Kamoamoa eruption - USGS Volcano Watch
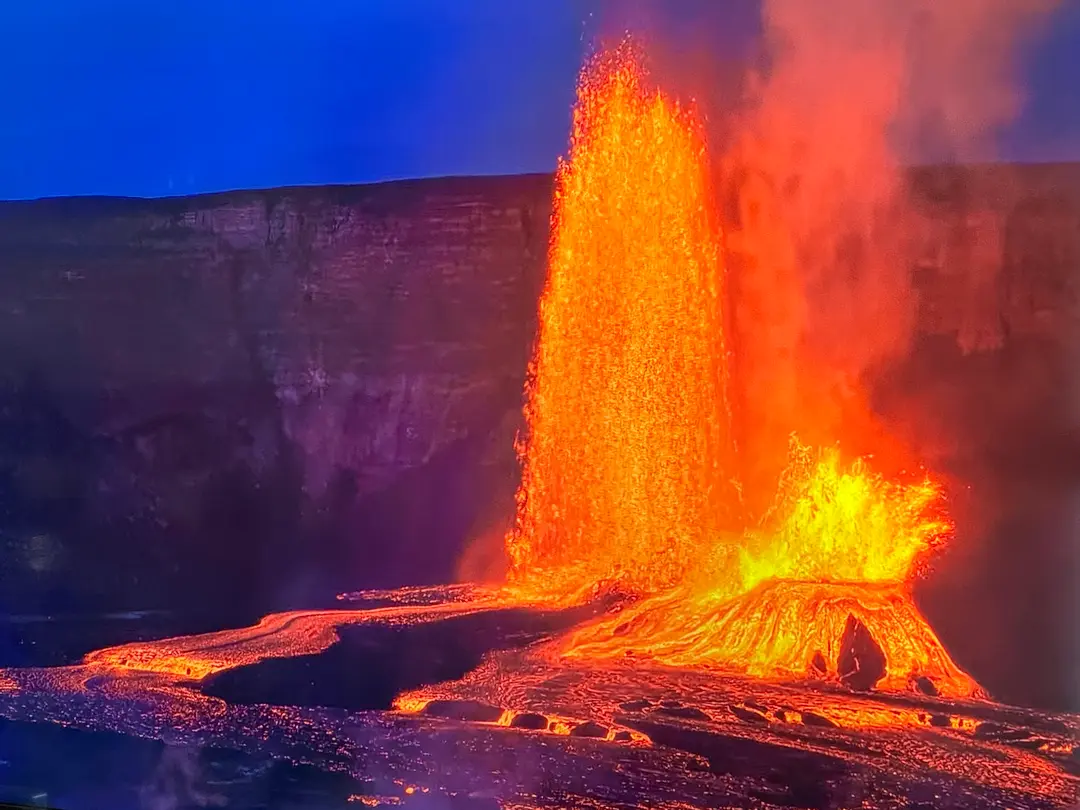
The 35-year-long Pu‘u‘ō‘ō eruption on the middle East Rift Zone of Kīlauea was a remarkable opportunity for scientists to improve volcano research and monitoring. Even short-lived episodes in this eruption, like the four-day-long Kamoamoa eruption, offered important insights. For the 11th anniversary of the Kamoamoa eruption, this week’s “Volcano Watch” is a photo essay that highlights the episode and some of the data collection efforts. In the months leading up to the Kamoamoa eruption, lava filled Pu‘u‘ō‘ō crater. Steady inflation was recorded at Kīlauea’s summit and the middle East Rift Zone. As the system pressurized, seismicity increased in the upper East Rift Zone and the summit lava lake rose to the highest levels recorded before that time. On March 5, 2011, seismic tremor and increased earthquake activity, accompanied by rapid deflation at Pu‘u‘ō‘ō, began abruptly at 1:42 p.m. An intrusion uprift drew magma away from beneath Pu‘u‘ō‘ō. Shortly after, the Pu‘u‘ō‘ō crater floor began to subside and the summit lava lake level dropped. The USGS Hawaiian Volcano Observatory (HVO), alerted by near real-time seismic alarms and deformation data, quickly conducted an overflight of the area and witnessed the start of the Kamoamoa eruption at 5:09 p.m. between Pu‘u‘ō‘ō and Nāpau craters. In the first few days, eruptive activity shifted around two fissure systems with vents repeatedly starting and stopping. Early on March 8, the eruption focused on the two opposite ends of the fissures. The activity waned in the afternoon of March 9, and around 10:30 p.m. the Kamoamoa eruptive episode was over. The dike and subsequent eruption acted as a pressure release valve of Kīlauea’s magma plumbing system that had been pressurizing for months. This led to a short-lived eruption hiatus on the East Rift Zone and low lava lake levels at the summit while the system recovered. During the eruption, to supplement the near real-time data from HVO monitoring stations, scientists also collected lava samples and gas measurements, mapped lava flows and ground cracks, took photos and detailed field notes, along with other tasks. These important data sets help us to better understand volcanic eruptions and their processes. Analyses of multiple lava samples taken throughout the eruption showed that the erupted lava was initially more evolved than the lava collected on the Pu‘u‘ō‘ō flow fields prior to the Kamoamoa eruption. This means that the dike which fed the eruption either pushed out, or mixed with, a body of cooler magma that had been stored in the rift. As the eruption continued, the lava compositions began to resemble those previously erupted at Pu‘u‘ō‘ō, as “fresher” lava flushed through the system—like what we saw in the beginning of the 2018 lower East Rift Zone eruption. Studying eruptive episodes on Kīlauea’s East Rift Zone using a multi-disciplinary approach has improved scientific understanding of the volcano. Recognizable precursory changes observed at the summit and Pu‘u‘ō‘ō have helped HVO anticipate new eruptions including Kamoamoa and the 2018 lower East Rift Zone eruption. For over a year, Kīlauea eruptions have been confined to the summit with no indications of magma migration into the East Rift Zone, providing scientists with additional opportunities to learn about the volcano. --- Images and captions from USGS --- Volcano Watch is a weekly article and activity update written by U.S. Geological Survey Hawaiian Volcano Observatory scientists and affiliates. [1] A geologist collects a molten lava sample from the Kamoamoa eruption. USGS photo taken by M. Patrick on March 6, 2011. [2] After an intrusion on March 5, Pu‘u‘ō‘ō crater floor subsided for several hours. Hot incandescent crater walls were exposed as the floor dropped a total of 113 m (371 ft). Frequent rockfalls into the crater triggered red ash plumes. USGS photo taken by T. Orr on March 5, 2011, at 4:32 p.m. [3] Aerial photo of the Kamoamoa eruption on March 7, 2011. The western fissure feeding a channelized ‘a‘ā flow is visible in the lower right, while the eastern end of the fissure system and Pu‘u‘ō‘ō crater are in the upper left. USGS photo by T. Orr. [4] Hawaiian Volcano Observatory scientists map and measure ground cracks during the Kamoamoa eruption. USGS photo taken by N. Richter on March 6, 2011. [5] Scientists collect volcanic gas data using a Fourier Transform Infrared spectrometer (FTIR). During the Kamoamoa eruption, sulfur dioxide emission rates from Kīlauea’s East Rift Zone reached the highest levels since the episodes of high-fountaining at Pu‘u‘ō‘ō (1983–1986) with an average rate of 8,500 tonnes per day and a peak value of 11,000 tonnes per day. USGS photo taken by J. Sutton on March 6, 2011.