Evgenia Ilyinskaya Talks About Issues Modeling VOG With The Mauna Loa Eruption
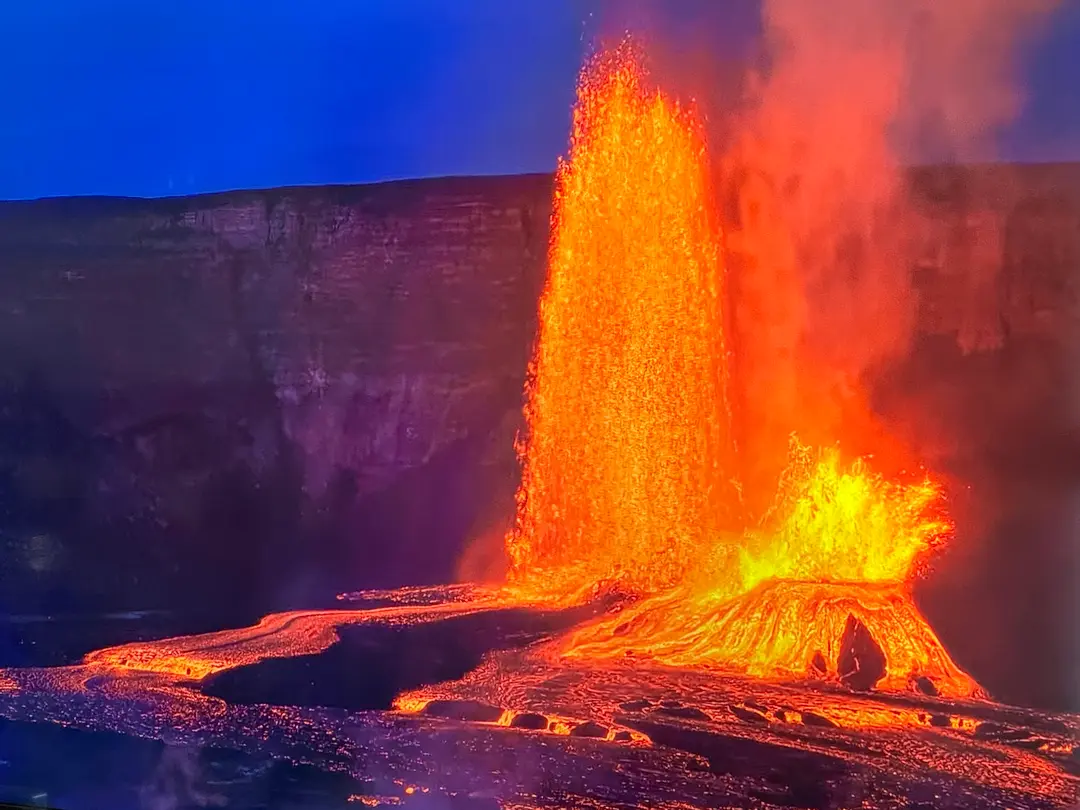
Written by Evgenia Ilyinskaya - Several people have raised a valid question about the apparent discrepancy in air pollution levels predicted by the VMAP vog forecast (http://mkwc.ifa.hawaii.edu/vmap/new/) and those measured by the HDOH air quality stations (https://air.doh.hawaii.gov/home/map). At the time of writing, the HDOH air quality stations have *not* recorded elevated air pollution since the start of the eruption, but the VMAP forecast appears to be showing elevated volcanic pollution across the island and beyond. Vog Talk asked me to write about this and I was happy to oblige because this is exactly the area I research as an Associate Professor at the University of Leeds, UK. I make measurements of volcanic air pollution, including in Hawaii, and compare them to the forecasts made by computer models such as VMAP. What is the difference in how VMAP and HDOH stations function? - The pollution levels reported by the HDOH stations are very precise, real-time measurements of pollution concentrations. These measurements reliably inform people what air quality is at that moment in time in that location, at ground level. - The VMAP model, and other similar models, use computer calculations to simulate the dispersion of volcanic air pollution. These models are very much like a weather forecast. They will tell people where and when pollution *might* be expected, but they are not real-time measurements, and have a high degree of uncertainty. I will explain the reasons for the uncertainty below. - A very important point is that the VMAP website displays the predicted vog concentrations levels between 0 and 100 meters (~100 yards) above ground level. In other words, the vog levels shown on the VMAP map can actually be anywhere between ground level and 100 yards up in the air. The reason for this is the uncertainty in the model calculations. Why does the VMAP model have an uncertainty and predicts different levels of pollution to what the HDOH stations are measuring? The short answer is that it is technically extremely difficult to accurately forecast (i.e. predict in advance) when and where vog is going to be exactly at ground level, and in which concentrations. There are many factors about the environment and the eruption itself, which limit the so-called 'skill' of the model. Some examples of these factors are below, but this is not an exhaustive list: - As everyone knows, weather forecasts are never 100% accurate - and the smaller the meteorological event, the harder it is to forecast with high precision. For example, short-lived rain showers are extremely hard to pin-point exactly with respect to timing, location, and the rain intensity. Volcanic eruptions are actually also relatively small-scale events and therefore difficult to simulate with high precision in a computer model. - There hasn't been an eruption at Mauna Loa since plume dispersion models have existed so there hasn't been an opportunity to test and tune the model in a real life scenario. A little bit of trivia: a big push for the development of pollution dispersion models came after the Chernobyl disaster in 1986, which post-dates the last eruption of Mauna Loa. Scientists setting up the dispersion models use real-time observations (such as from the HDOH stations) to tune their models, meaning that as the Mauna Loa eruption continues, the accuracy of the VMAP model is likely to improve. You might wonder why the VMAP model hasn't "learned" enough from the Kilauea eruptions in the past - in fact, it has gained a lot of skill from those eruptions but Mauna Loa is a very different beast. The elevation, the topography, are some of the important factors. Therefore, the model will need more information from the current eruption to really up its skill. - The emission rate, also called flux, of sulfur dioxide (SO2) gas from the eruption is one of the main controls on the vog levels downwind. The difficulty is that the flux is typically highly dynamic and may vary a lot and very fast in eruptions, sometimes as fast as a few minutes. For example, the emission rate can be very high during more energetic lava fountains, and then drop down low in between. But it is often only possible to make one flux measurement per day, and sometimes not possible for many days in a row if, for example, the weather conditions are not right. "It is like trying to listen to a symphony by hearing only one note every minute" is a good analogy for this problem! so if the vog dispersion model is only 'fed' one SO2 flux measurement a day it cannot predict changes that result on finer time-scales. - The so-called 'injection height' of the SO2 gas is another important factor and is also difficult to feed accurately into the model as it is equally dynamic. The injection height refers to how high the gas is lifted above the eruption vent before it is transported away by the wind. This depends on the intensity of the eruption and can also fluctuate on minutes-, hours-, and days-long time scales. - Eruptions create their own weather! The extreme heat from the lava impacts the wind and precipitation patterns in the local area. Many people will have seen photos of 'fire tornados' around the 2018 Lower East Rift Zone eruption of Kilauea. Another example is heavy but very localised rainfall from volcanic plumes, which was also seen often in 2018. These extremely small-scale but important meteorological events are not simulated by regional weather forecasts, which is what is fed into models such as VMAP, creating another source of uncertainty. - large and small-scale variations in topography and even vegetation cover impact the vog dispersion and are difficult to simulate with high resolution. One way of thinking about it is resolution in computer games. Even in some of the more advanced ones, little features like blades of grass don't look exactly like real life! Computer simulation capabilities are developing extremely fast and are amazing, but they are still not exactly like real life. These are just some examples of the challenges faced by models like VMAP. Why do we use vog dispersion models like VMAP if they have so much uncertainty? The answer is that a forecast with some uncertainties is still better than no forecast. Most people prefer to know that there is a chance of a storm (or even just a rainshower) even if it doesn't then materialise. Real-time measurements from HDOH stations can only tell us what is happening right now, but not what may happen in a few hours or the next day - we need a model to do that. Another important reason is that high-quality, high-accuracy air quality stations, such as those from HDOH are very costly to set up and maintain and therefore are sparse. There are large areas in between them that have no direct measurements and the model can 'fill in the gaps'. The main message is that *all* models have uncertainty, and should never be treated in the same way as real-time measurements - they should be used as a forecast only. Hope this is of some interest and use, happy to hear your thoughts and questions! Aloha Photo taken from Mauna Loa observatory in 2018 which shows vog from Kilauea drifting across the base of Mauna Kea ------ End of Text by Evgenia Ilyinskaya ------ Evgenia Ilyinskaya is an associate professor at SEELeeds researching volcanoes, air & environmental pollution. We assisted her in collecting water samples from catchment tanks in Leilani Estates following the 2018 Kilauea eruption. Her research on the eruption plume in 2018 can be found here: https://www.nature.com/articles/s43247-021-00146-2