On The Road Again: Chasing Mauna Loa’s Gas Plume — USGS Volcano Watch
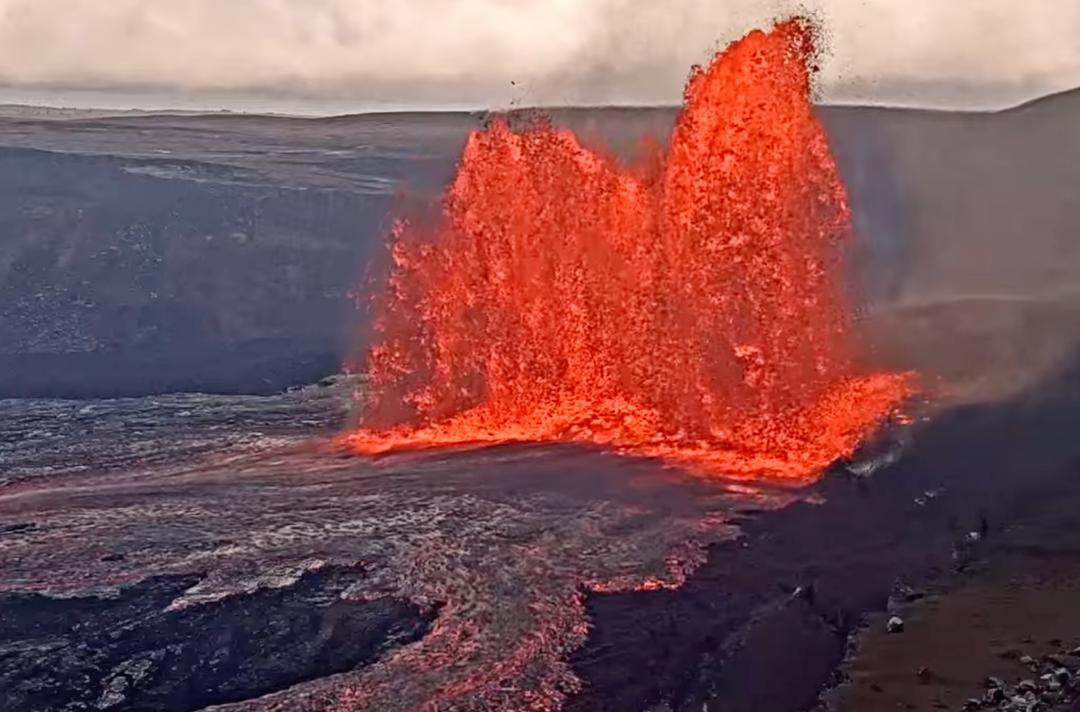
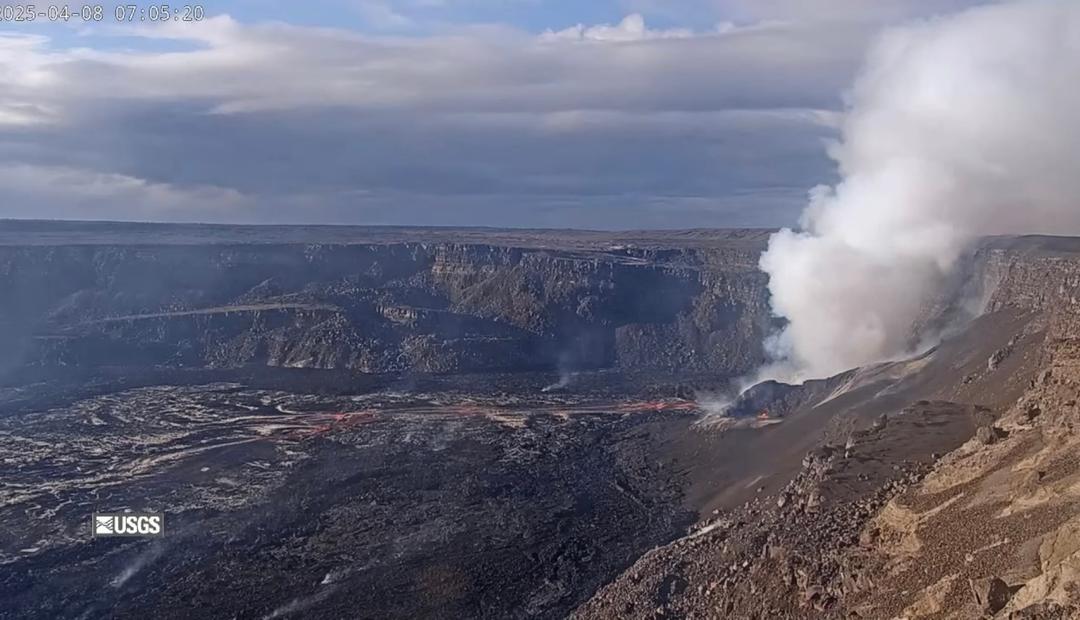
When Mauna Loa erupted in November 2022 for the first time in nearly forty years, one of the main concerns was the lava and where it would flow. But Mauna Loa didn’t only erupt lava – as with all other volcanic eruptions, many tonnes of volcanic gases were emitted from the active vents. Volcanic gases emitted during eruptions include water vapor, carbon dioxide (CO2), and sulfur dioxide (SO2). During eruptions, the Hawaiian Volcano Observatory (HVO) aims to characterize both the chemistry and amount of gas being emitted. SO2 emission rates are a key parameter to measure, as they can be used as a proxy for lava effusion rate and they dictate how much vog, or volcanic air pollution, there is downwind. Typically, we measure SO2 emission rates using a vehicle-mounted ultraviolet spectrometer, which we drive beneath the plume. At Kīlauea, because the trade winds tend to blow the summit plume in a single direction, we have a permanent array of spectrometers to measure SO2 there, so we don’t have to do as much driving. Driving on Chain of Craters Road for the Puʻuʻōʻō eruption and on Highway 130 for the 2018 lower East Rift Zone eruption were our common means of measuring the plume in the trade wind direction for these other Kīlauea eruptive sites. Mauna Loa, however, at such a high altitude compared to Kīlauea, experiences different wind patterns, and winds were very variable during the eruption. Sometimes measurements of high-altitude plumes can be made relatively easily by flying an airplane or a helicopter beneath the plume instead of driving. However, the Mauna Loa plume had not only high concentrations of gases, but also contained particles, like Pele’s hair, which could adversely affect an aircraft flying under it. So what did that mean for the HVO gas crew during the eruption? We had to shift gears and do a whole lot of driving! Over the course of the roughly two-week eruption, the winds took the plume in many directions, including over Saddle Road, Ocean View, Pāhala, Puna, Hilo, Kailua-Kona, and Captain Cook. This meant that the HVO gas team drove nearly 3,000 miles (4,800 km) in total! Ultimately, all the driving paid off and we succeeded in measuring emission rates on ten separate days. This allowed HVO to report these emission rates to the public and to vog forecasters during the eruption. ---- Image and caption from USGS: [1] Mauna Loa’s Fissure 3 gas plume, with rain clouds, as seen from the Saddle Road on November 29, 2022. The orange-brown tint near the vent is due to scattering by aerosols in the plume. The dark gray clouds are a mix of plume with what are called pyrocumulus clouds, or clouds that the volcano itself generated via the intense heating of the air by the erupting fissure. USGS photo by M. Warren. [2] Mauna Loa’s Fissure 3 gas plume as seen from the Saddle Road on December 2, 2022. Winds were from the northeast at the time the photo was taken, and spread the plume over much of the island to the south and west of Mauna Loa summit. USGS photo by P. Nadeau. ---- Volcano Watch is a weekly article and activity update written by U.S. Geological Survey Hawaiian Volcano Observatory scientists and affiliates.