Where Might Lava Flow - USGS Steepest Descent Lines And How To Use Them
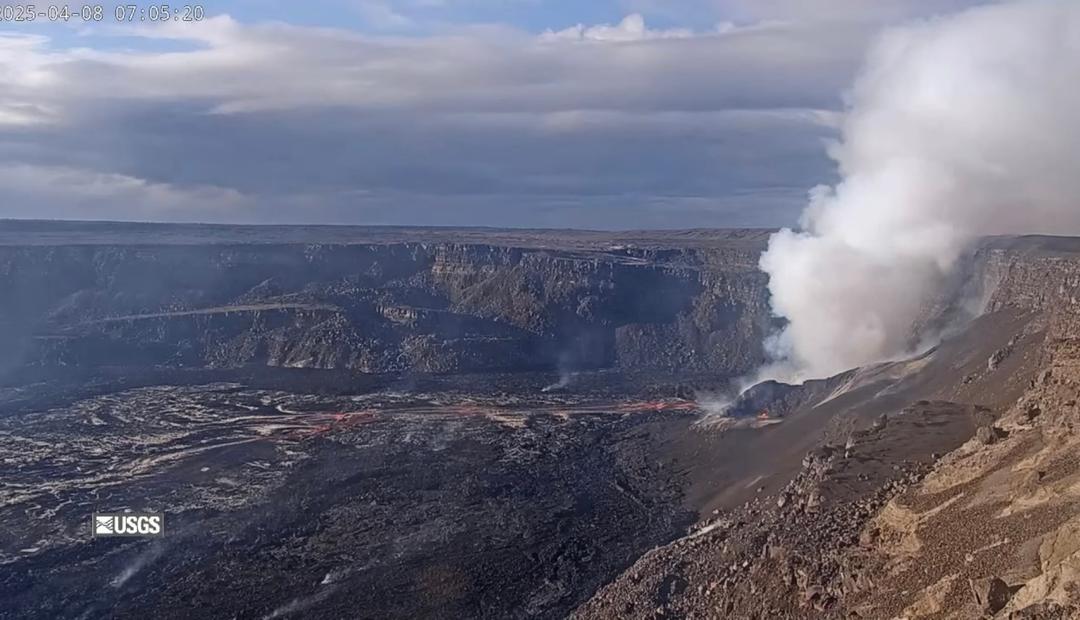
Lava flows associated with volcanic eruptions carry a high degree of unpredictability, but the USGS Hawaiian Volcano Observatory has created a public tool to help island residents and responders with emergency planning and flow-path forecasting. This is the “Steepest-Descent Lines for Kīlauea, Mauna Loa, Hualālai, and Mauna Kea Volcanoes, Hawaiʻi” map layer compatible with Google Earth Pro and GIS software. On the map, each descent line represents the steepest, most likely downhill path that a lava flow could take from upslope, enabling considerations of potential impacts on infrastructure and accessibility. The Steepest Descent Lines (SD Lines) are a good a general guide on where lava is most likely to flow, but there are a few complications to consider. - SD Lines work best for initial lava flows, because later flows can be diverted by the topography created by flows earlier in the same eruption. An initial lava flow can stop early in an eruption only to later provide a barrier and alter the course of the next lava flow. - Lava flows can branch into multiple fronts that take different paths downslope over the course of an eruption. - SD Lines are only as accurate as the digital elevation model (DEM) from which they are derived and the chosen drainage threshold. This means there is a limit to their resolution, in this case a minimum drainage of ~185 acres, which ignores more localized effects and inaccuracies. - Factors outside of the scope of the map can influence lava flows, such as biomass and human infrastructure, including but not limited to roads. - Areas without much slope are more unpredictable. A comparison of the 2018 lava flows to the previous steepest descent lines illustrates the general nature and usefulness of this approach, as well as some of the complications (image 1). The files provided in USGS’s ScienceBase Steepest-Descent Lines include two levels of refinement for the SD Lines in formats compatible with ARCgis, QGIS, and Google Earth Pro (see KMZ files). The files with the “750K” suffix plot a minimum drainage of ~185 acres, while the files with the “3M” suffix plot a minimum drainage of ~741 acres (a lower resolution, more generalized version). There are also some shapefiles for previous eruptions on Mauna Loa and Kīlauea provided. Steepest-Descent Lines available here for download: https://www.sciencebase.gov/catalog/item/57fd072ee4b0824b2d130eb5 ---------- For those that want to view the shapefiles for themselves but don’t know exactly how, here is the simplest free solution: Step 1: Go to https://www.google.com/earth/versions/ ”Download Earth Pro on desktop” and follow the installation instructions provided. Step 2: Download “steepest-descent Data Release.zip” from https://www.sciencebase.gov/catalog/item/57fd072ee4b0824b2d130eb5 Step 3: Unzip the downloaded file. Step 4: Navigate into the unzipped file and double click: “SteepestDescent_lines_3M_m2.KMZ” or “Steepest-Descent_lines_750K_m2.KMZ”. Step 5: The map should open, wait for it to load and then you can explore. Right click a blue SD Line and select “Show elevation profile” to get the tools shown in the attached image (image 2).