Water Samples Followup, Post 2018 Eruption Lerz Of Kilauea In the 2018 eruption of Kīlauea tremendous amounts of volcanic gases and particulate matter saturated Lower Puna near the eruptive fissures and downwind of their locations. Dr. Evgenia Ilyinskaya and her team of gas specialists from Universities of Leeds, Cambridge and Oxford in the UK were invited by USGS-HVO to study the emissions in July 2018 around Lower Puna. Their research shed new light on the fallout from the eruptive fissures, primarily regarding soluble heavy metals such as copper, lead, zinc, cadmium, etc. Following the end of the 2018 eruption Dr. Ilyinskaya returned to Puna to follow up on the data collected previously. We put out a request on Hawaii Tracker in July 2019 for residents on the edges of the 2018 LERZ eruption to allow us to pull water samples from their catchment tanks. We received an overwhelming response, filling every sampling container that the professor brought with her in the process. Samples were analysed at University of Leeds laboratories using Inductively Coupled Plasma Mass Spectrometry (ICP-MS) and Optical Emission Spectrometry (ICP-OES). Water samples were filtered prior to analysis to remove insoluble particles. This is a standard methodology for quality analysis of water samples. The biggest take away is that catchment tanks sampled after the eruption were below contaminant levels recommended by the EPA, even untreated catchments in very close proximity to Fissure 8 which exceeded EPA limits when tested during the eruption. Dr. Ilyinskaya’s thorough analysis looked at 60 possible elemental contaminants, of which 11 are listed by the EPA as contaminants for drinking water, at 27 different sites selected around the Big Island, during and after the eruption (total of 43 samples). This is a preliminary summary of those results, currently in preparation for publication. While it can be tricky to compare the first and second rounds of sampling in slightly different numbers and areas, for each contaminant we isolate the top 5 highest measurements to examine. The maximum values are useful, but also influenced by outlier effects (for example within a specific catchment tank). Thus, to standardize our comparisons and see the big-picture view past the outliers, we use the average of the 2nd through 5th highest measurements both during and after the 2018 eruption. After the eruption, 47 of the 60 contaminant types analyzed decreased their average concentration or remained unchanged. Among EPA-listed contaminants: selenium dropped by 99%, cadmium by 98%, fluoride by 96%, thallium by 95%, copper by 95%, arsenic by 90%, lead by 75%, and antimony by 41%. These are all welcome changes, as samples in Leilani Estates during the eruption measured selenium at 148% of the EPA limit, cadmium at 220%, fluorine at 275%, copper at 846%, and lead at 340%. All have dropped to acceptable levels in the post-eruption samples. Note that only one tank was sampled in Leilani Estates during the eruption (Alapai St south x 3 samples); in addition, 3 rain samples were collected in the same location. Of the remaining 13 contaminants measured there are 3 of EPA concern, but their maximum values are still well below EPA threshold levels for action: barium (at 3.1% of EPA limit), beryllium (2.8%) and chromium (10%). DATA SUMMARY: EPA contaminant concentrations during and after the 2018 eruption, as % of EPA limit | EPA Contaminant | Max % of EPA Limit, during eruption | Max % of EPA Limit, after eruption | Avg % of EPA Limit, during eruption | Avg % of EPA Limit, after eruption | | --------------- | ----------------------------------- | ---------------------------------- | ----------------------------------- | ---------------------------------- | | Selenium | 148% | 1.5% | 38% | 0.4% | | Cadmium | 220% | 1.6% | 67% | 1.1% | | Fluoride | 275% | 5.5% | 102% | 4.3% | | Thallium | 22% | 1.1% | 10% | 0.5% | | Copper | 846% | 27% | 18% | 1.0% | | Arsenic | 69% | 1.4% | 12% | 1.2% | | Lead | 340% | 13% | 28% | 7.0% | | Antimony | 48% | 158%* | 18% | 10% | | Barium | 0.6% | 3.1% | 0.3% | 0.5% | | Chromium | 2.2% | 10% | 0.9% | 2.4% | | Beryllium | 0% | 2.8% | 0% | 0.5% | *: maximum or minimum concentrations may have increased, but on average decreased. *: maximum or minimum concentrations may have increased, but on average decreased. Elements not listed as water contaminants: Traces present during eruption, but completely gone after: Terbium, Holmium, Erbium, Thulium, Ytterbium, Hafnium, Tantalum, Thorium Decrease in average concentration: Rhenium (dropped 99%), Niobium (-98%), Praseodymium (-97%), Zirconium (-97%), Cerium (-96%), Lanthanum (-96%), Neodymium (-96%), Samarium (-96%), Tellurium (-96%), Gadolinium (-95%), Dysprosium (-95%), Europium* (-93%), Titanium (-87%), Zinc (-86%), Iron (-82%), Aluminum (-76%), Sulfate (-76%), Scandium (-71%), Sulfur (-68%), Lithium (-66%), Uranium (-63%), Gallium (-96%), Chlorine (-57%), Indium (-40%), Sodium (-34%), Magnesium (-9%), Nickel* (-89%), Cesium (-51%), Potassium* (-19%) Increase in average concentration: Manganese* (+9.2%), Cobalt (+15%), Calcium (+16%), Rubidium (+37%), Vanadium (+95%), Molybdenum (+199%), Tin (+282%), Silver (+365%), Phosphorous (+544%), Boron (none before) Phosphorus is not known to be present in significant quantities in volcanic emissions, but more typically sourced from soils (especially where fertilizer is used). Most of the non-contaminant elements (with the exception of sulfur, sulfate, chlorine, indium) are sourced from ash-type particles (for example Pele’s hair) rather than from volcanic gas. These elements will be also found in high quantitites in volcanic rocks, Hawaiian soils and airborne dust. This may explain why the concentrations of some them has not changed, or even increased in 2019 compared to 2018. This may particularly happen in tanks which have remained unused since the eruption, allowing windborne soil to accummulate. None before or after: Strontium It’s difficult to characterize specific compounds without analyzing additional information from owners. For example, bleach or colloidal silver added to catchment water for purification, old copper pipes, or contamination by water from during the eruption could all obscure specific conclusions. However, in broad strokes it’s obvious that post-eruption samples are much cleaner, and Puna residents need not worry about ongoing volcanic contamination of their water.https://youtu.be/iMtf_GYaKUA
Episode 44 Has Begun
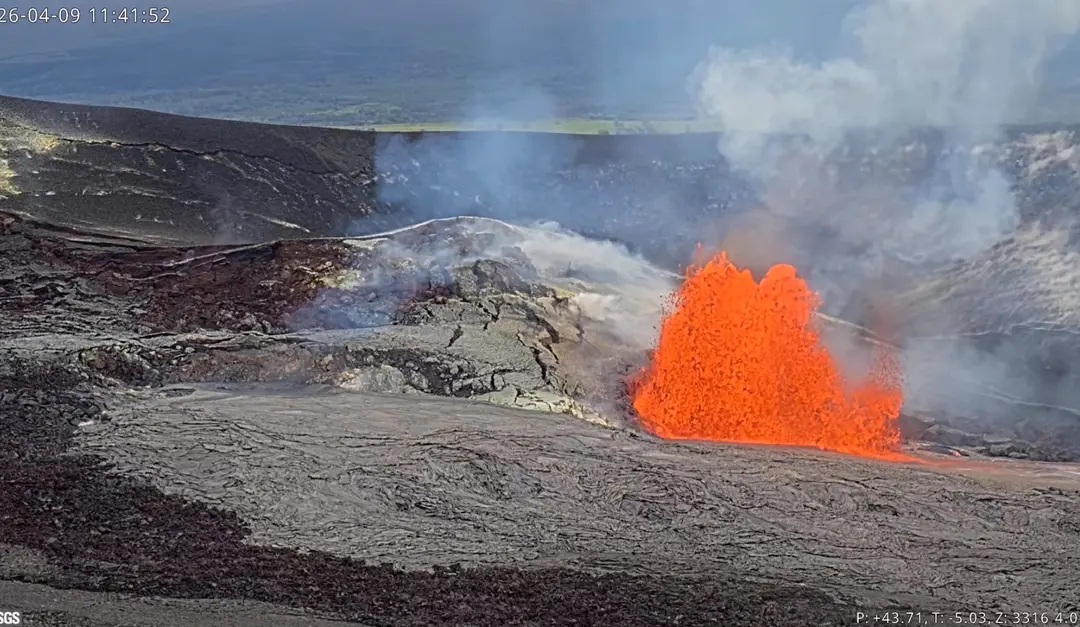
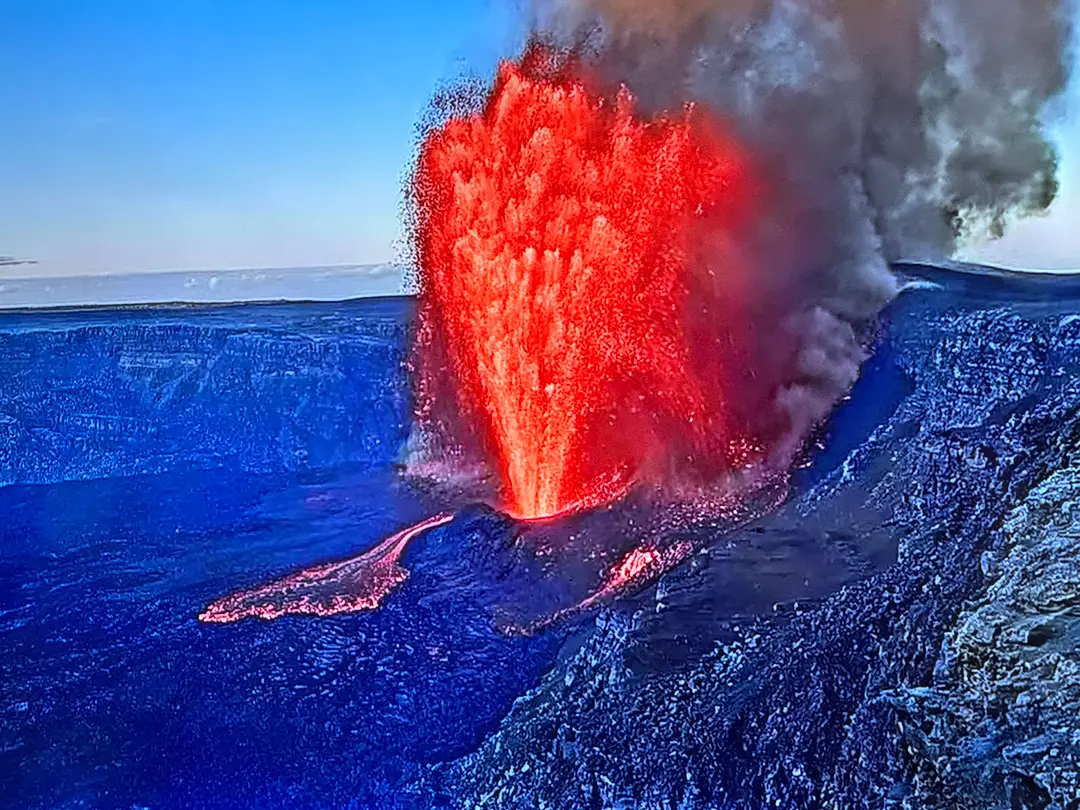
Kilauea Message 2026-04-09 11:36:36 HST. Lava fountains at the north vent in Halemaʻumaʻu are currently reaching about 35 meters (115 feet) in height, and they can be expected to reach maximum heights in 1–2 hours.
Ryan Finlay
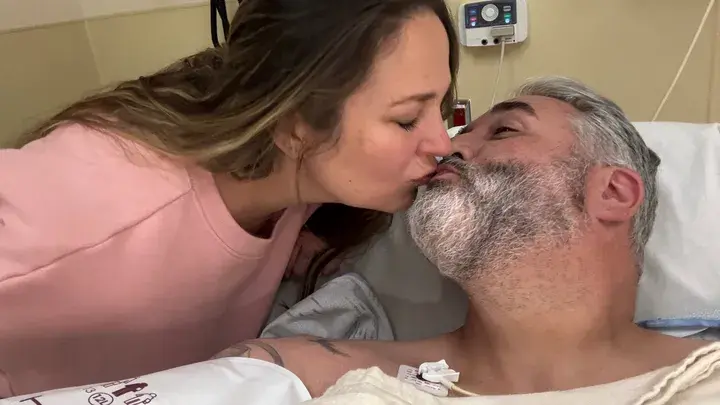
Help Ken Boyer in His Recovery Journey
Our friend Ken Boyer is facing some pretty serious health challenges right now. Ken was an early friend and contributor to Hawaii Tracker over 8 years ago now. Any support you can give him would be appreciated and please keep him and his ohana in your prayers! 🙏 If anyone would like to support Ken and his family you can do so at the link below. https://www.gofundme.com/f/liver-transplant-journey-recovery-nsvfc Here is the post Ken shared on social media today: "Hello my dear friends and family, this is gonna be a long one, sorry but I feel it’s time I share my story that very few know. The last few years have been extremely difficult for me and my family. We’ve suffered tremendous loss and I found myself feeling ill also. Very weak, extremely tired and fatigued, abdominal pain, unable to think clearly and at times not even being able to form sentences, unable to remember things, etc…I was very concerned and went to the doctor. After a series of tests and such I was ultimately diagnosed in November of 2023 with End Stage (Stage 4) Liver Disease (Cirrhosis) as well as several other related diagnosis, the worst being Hepatic Encephalopathy. Went to a few doctors to review the diagnosis. One was very hopeful and said may be able to get a transplant. Another said I had 6 months to live and it sure felt like it. Since then I’ve changed my diet, saw many specialists, been back and forth to Oahu and even to California. It is believed that this disease came on from a fall I had into stagnant water on a river back in 2008. At that time I contracted Leptospirosis. That was very difficult to navigate for quite some time but I did get better and I thought that was that. Apparently not… It’s heavily affected my ability to work. We tried many things attempting to keep Rico’s Taco Shop open but it just wasn’t able to operate successfully without me being present. My wife did an amazing job of trying to keep it going. She was just working herself to death though. She ultimately was able to secure a great job and I have since been unable to find a way to operate Rico’s. This has been crushing to us in so many ways. My dream business, emotionally, financially…. Needless to say, it’s been a roller coaster. This has pushed us to the breaking point in so many ways and continues to daily. The hardest part is what I see it doing to my wife and kids. They are amazing. My wife has been by my side through all of this and I can’t thank her enough for all that she’s done. The kids are affected a lot and it kills me. I don’t have the energy to be there with them and present like I’d like to be. They are strong. They know daddy has some health issues but don’t understand the extent of it. My oldest daughter is aware but living in the mainland at this time. Unfortunately the cirrhosis has progressed and has made it impossible to do much. A lot of days I’m unable to drive even. There’s been countless trips to the ER and stays in the hospital due to this as well as many procedures and medications. Currently I’m on 12 medications. I will need a transplant to live and I’m working towards that. However I will be having to move to either Oahu or California to do so. I’m working on getting disability but have been denied and have to keep pushing for it. My days consist of falling asleep at all times out of nowhere, even standing up. Or the opposite, extreme insomnia. The day to day of all the symptoms is overwhelming and I won’t bore you with it all. Some are very ugly too, you don’t wanna know lol. The cost of ongoing care has been a huge burden on us as well and we do need help there also, somehow. I decided I needed to be transparent about this. I owe it to you all. You’ve all been such amazing friends and family that it only seems right. I’m sure some have wondered “what happened to that guy, he used to always be online”. Well, I just can’t be like I used to be. Life has become very mundane. The last thing I wanted to do was ask for any donations. We’ve been trying to do anything and everything we can to sell off everything to raise funds. We’re just not nearly close enough and currently not able to cover bills even. But my main concern is being able to get to Oahu or California when the time comes for a transplant. Which will happen sometime in the near future. I don’t know any other way to make this a reality. We have a lot of loose ends here that we will have to deal with financially before it’s possible to even leave and once I’m there I’ll need to rent a place to stay. Medical should cover the majority of the medical bills. Depending where I go. If I have to go to California the medical will be different and won’t cover nearly as much. But Oahu doesn’t have nearly as many viable livers annually. So that’s where the concern is as to where I’ll be going. Either way, no matter what happens, if you donate, it will be going to the ongoing cost of care, travel, housing, and anything else that is going to be out of pocket. If you can help, that’s fantastic and I appreciate it more than I could ever explain but a share means just as much. Thank you all! I will try to get back with everyone as much as I’m able to. Even a prayer!!! Love you all 🙏🏼"
Ryan Finlay
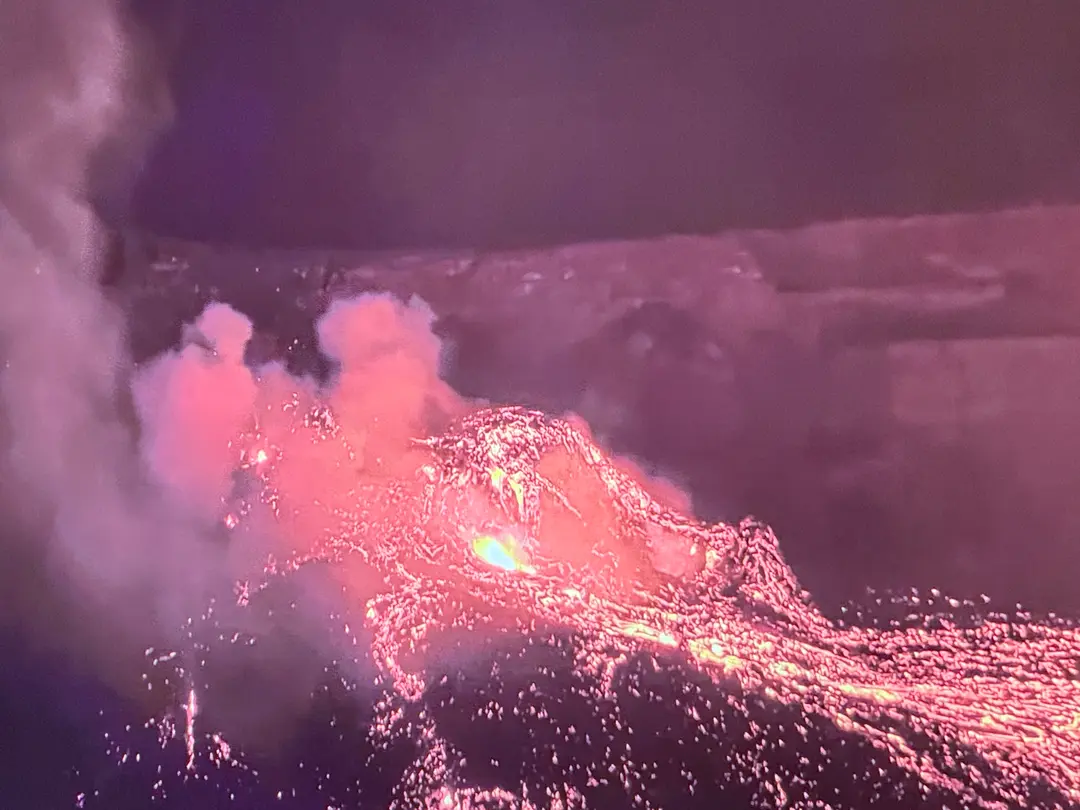
Episode 37 fountains have started
Episode 37 fountains have started!
Ryan Finlay
Episode 28
Update: Episode 28 of the ongoing Halemaʻumaʻu eruption ended abruptly at 1:20 p.m. HST on July 9, 2025, after 9 hours of continuous fountaining, the final 8 of which were high fountaining. The north vent stopped erupting at approximately 1:20 p.m. HST, marking the end of the episode. The south vent did not appear to activate at all during this episode and has been completely covered by new deposits. The growing cone around the north vent has begun to connect with the top of the surrounding cliff in some places. Lava fountains reached up to approximately 1200 ft (365 m) during this episode. Volcanic gas emissions have greatly decreased since the end of fountaining. Lava flows from this episode on the floor of Halemaʻumaʻu within the southern part of Kaluapele (Kīlauea caldera) may continue to exhibit slow movement or incandescence as they cool and solidify over the coming days. Slumping of molten cone material around the vent may also continue for the next 24 hours and can produce small, localized lava flows. The Uēkahuna tiltmeter (UWD) recorded about 15 microradians of deflationary tilt during this episode. The end of the eruption was coincident with a rapid change from deflation to inflation at the summit and a decrease in seismic tremor intensity. --------------------------------------- Episode 28 of the ongoing Halemaʻumaʻu eruption began at 4:10 a.m. HST on July 9 and is currently exhibiting a vent overflow and fountains reaching roughly 150 feet (45 meters). Past episodes have produced incandescent lava fountains over 1000 feet (300 meters) high that result in eruptive plumes up to 20,000 feet (6000 meters) above ground level. High fountaining associated with this episode has not yet begun but is expected to start soon, as tremor, deflation, and fountain height are all increasing. According to USGS weather stations just southwest of the summit, winds are blowing from the north-northeast direction at approximately 15 miles per hour, which suggests that volcanic gas emissions and volcanic material will be distributed south-southwest. Such trade winds typically turn more to the northeast during daylight hours. All eruptive activity is confined to Halemaʻumaʻu crater within Hawaiʻi Volcanoes National Park Three Kīlauea summit livestream videos that show eruptive lava fountains are available here: https://www.youtube.com/@usgs/streams
Ryan Finlay
Episode 24
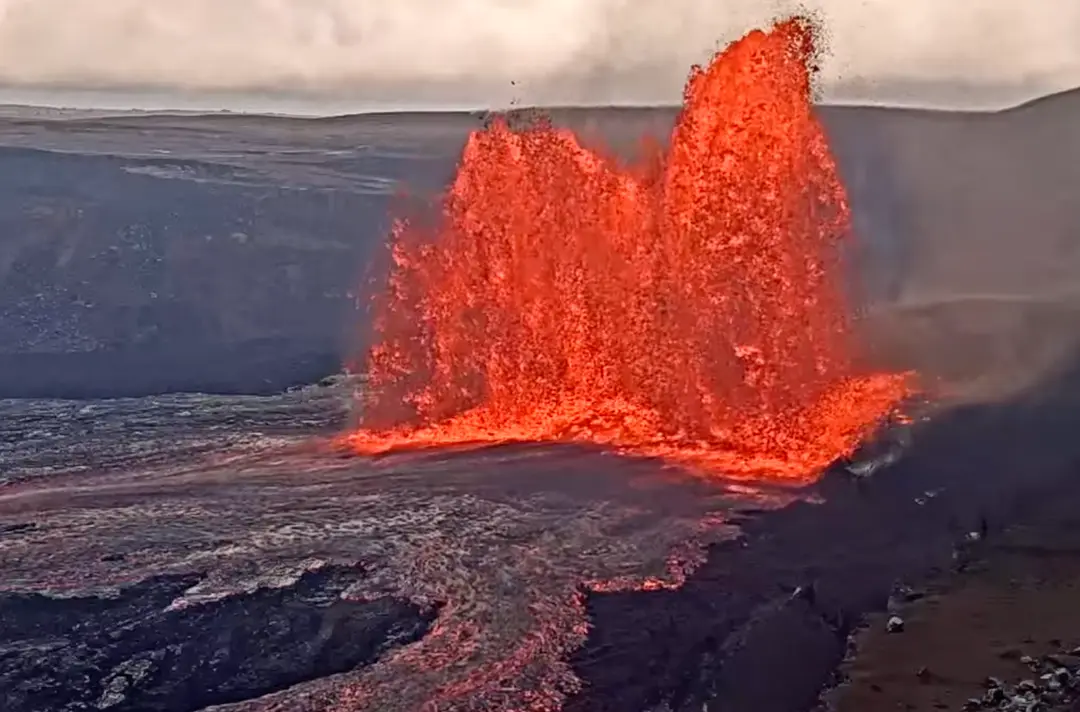
Episode 24 of the ongoing Halemaʻumaʻu eruption began at 8:55 PM HST on June 4 and is currently fountaining from the north vent. Episode 24 was preceded by sporadic spatter, gas pistoning, and hydrogen flames that began on the morning of June 3. At approximately 8:55 PM HST, episode 24 began with low dome fountaining accompanied by lava flows onto the crater floor. Small sustained lava fountains, less than about 100 feet (30 meters) high, began erupting from the north vent around 9:15 PM. Activity increased again around 10:10 PM, when fountain heights increased to 325 feet (100 meters) and by 10:40 reached over 980 feet (300 meters). Additionally, the fountain generated a plume that reached 16,500 feet (5,000 meters) above ground level by 10:50 PM and is increasing. At a tiltmeter near Uēkahuna (UWD), inflationary tilt reached just over 14 microradians since the end of the last episode; slightly more than the amount of deflationary tilt in episode 23. Seismic tremor began increasing and tilt at UWD switched from inflation to deflation at about 9:00 PM HST, close in time to the beginning of low fountaining. Most episodes of Halemaʻumaʻu lava fountaining since December 23, 2024, have continued for around a day or less and have been separated by pauses in eruptive activity lasting generally at least several days.
Ryan Finlay
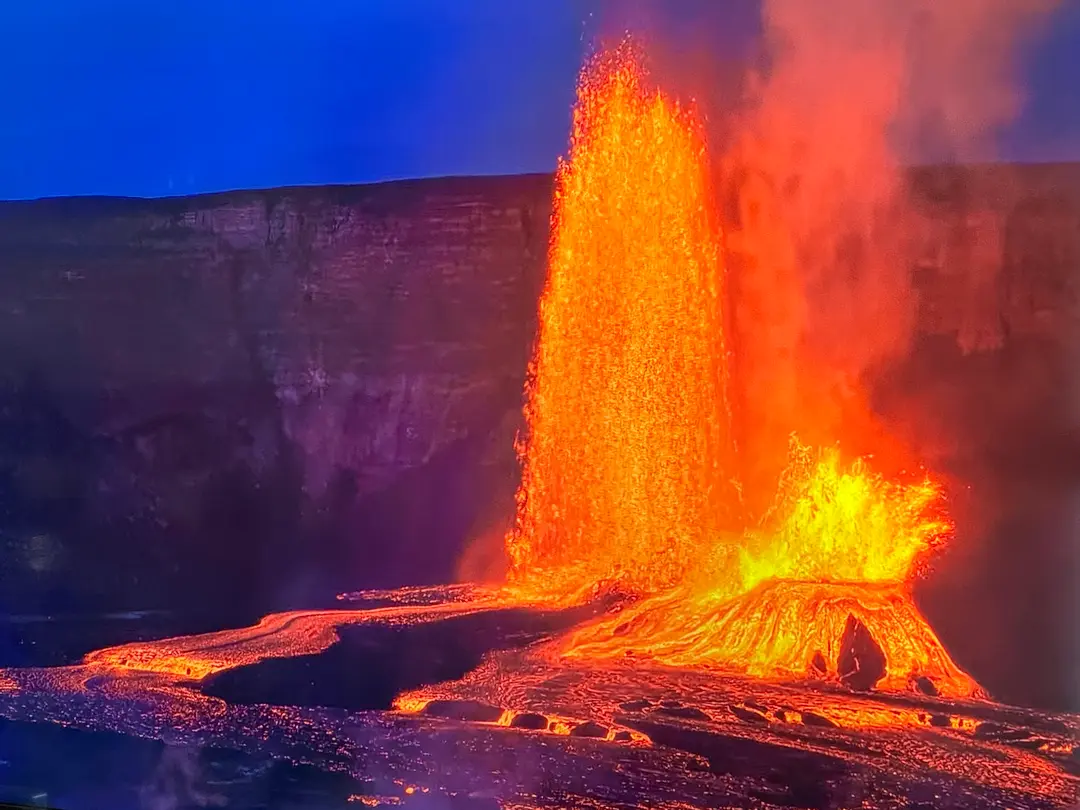
Episode 18 Fountains Have Begun
Episode 18 high fountains have started!
Ryan Finlay
Awesome thanks Dane!
Dec 11, 2019
Thanks guys!
Dec 11, 2019
Great summary!
Dec 11, 2019