2018 Eruption Science: The Largest Gravity Changes Ever Recorded
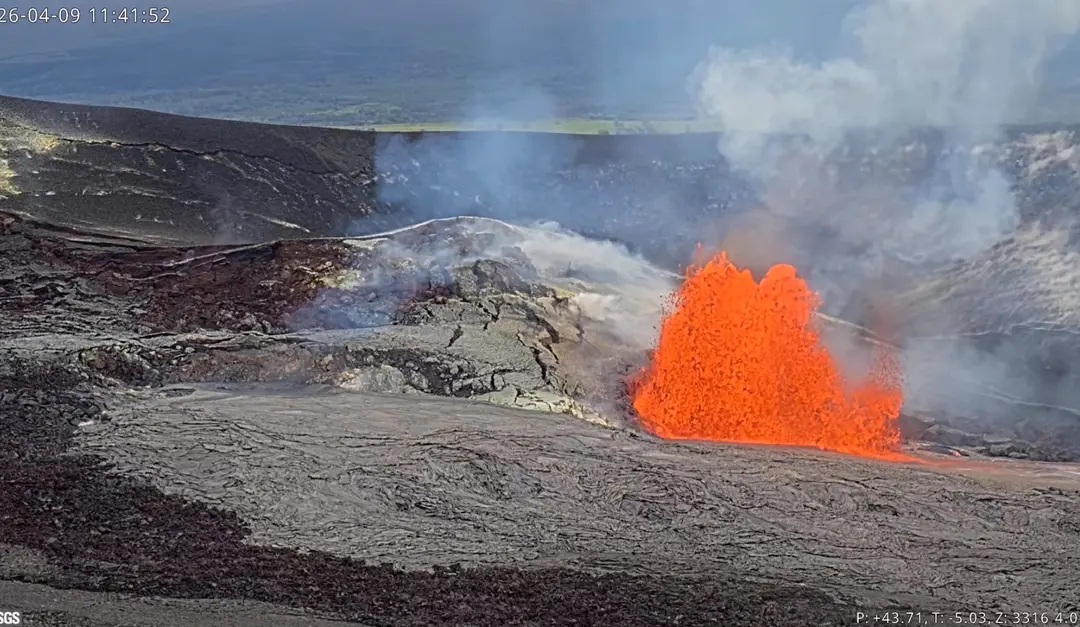
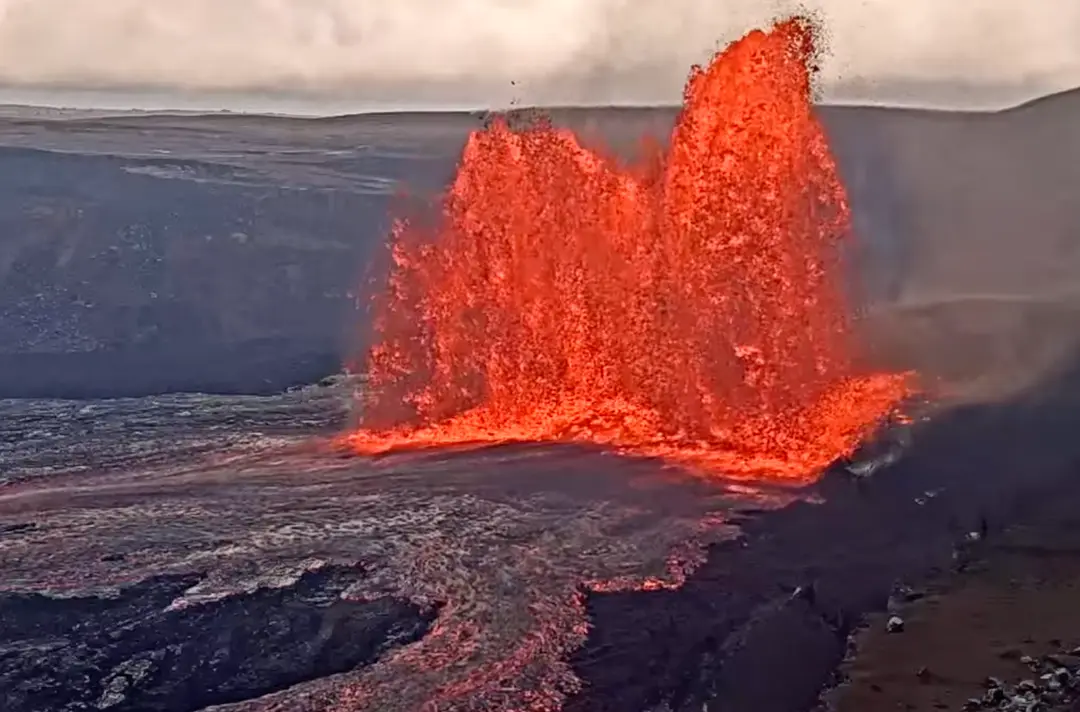
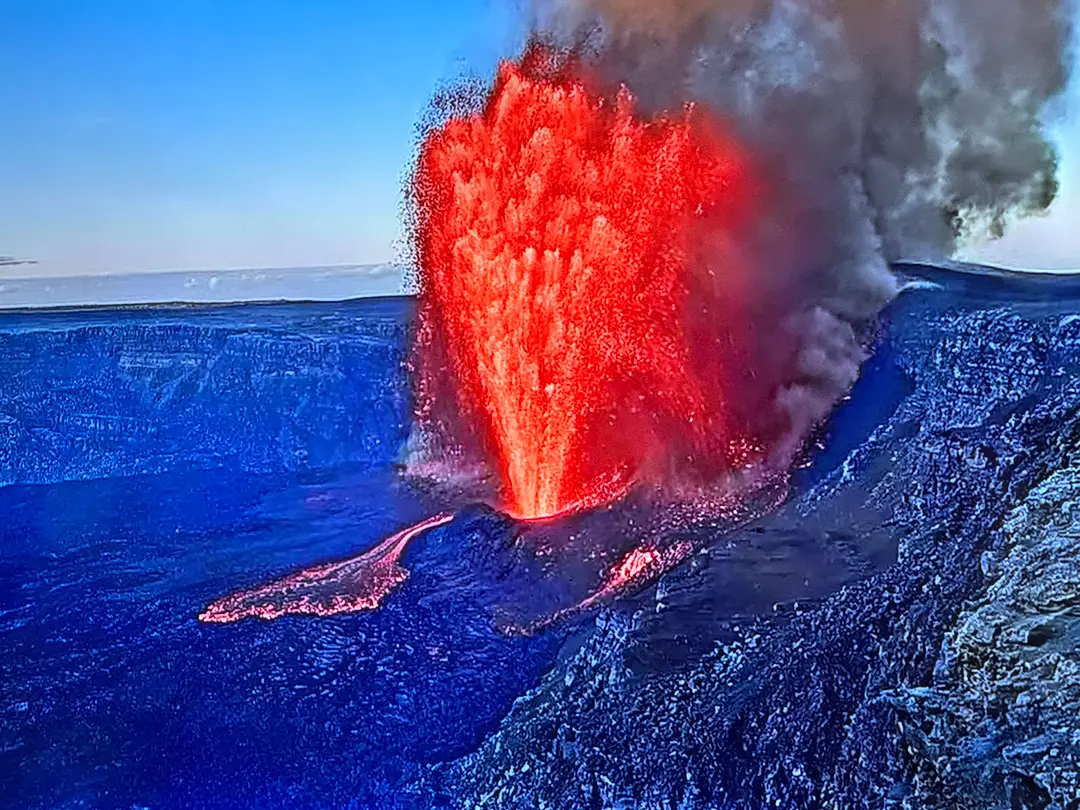
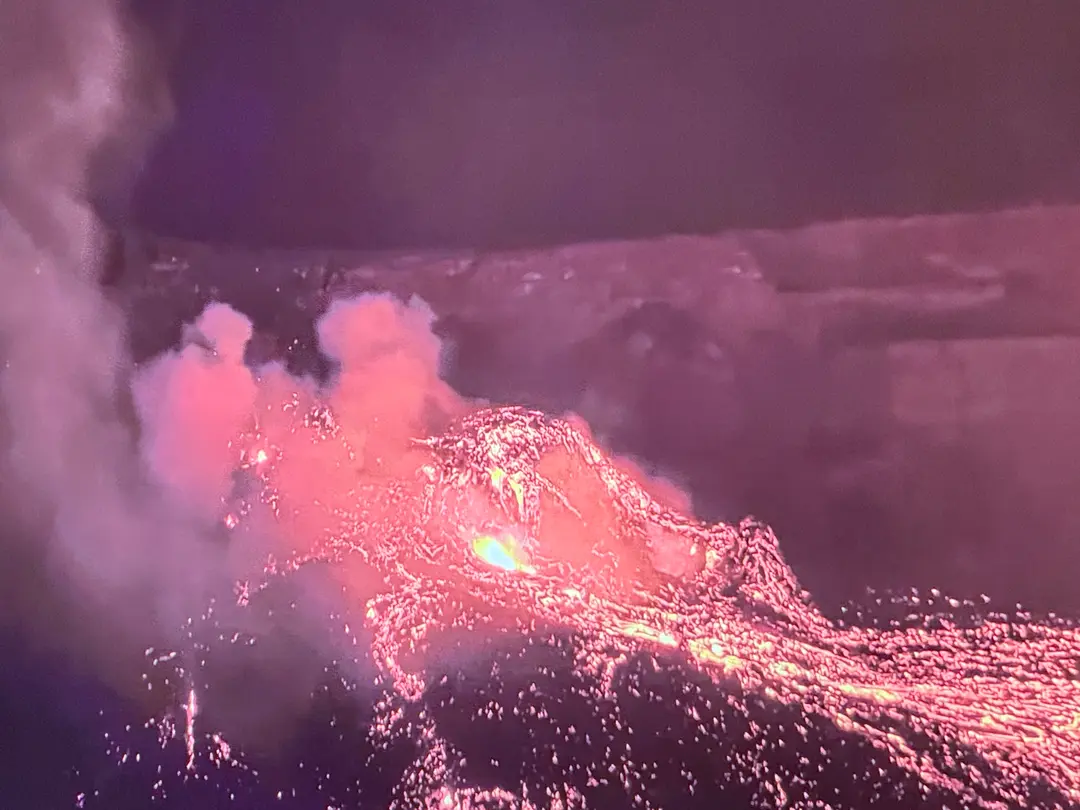
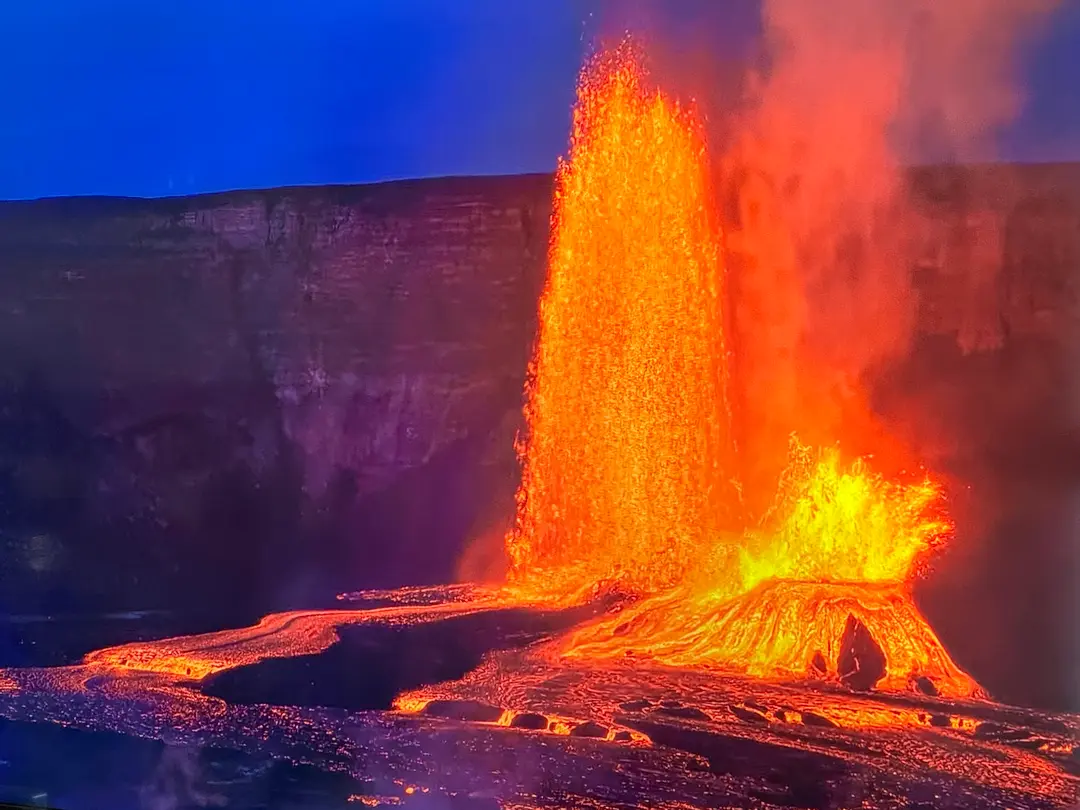
The two instruments measuring continous gravity changes on Kīlauea during its 2018 summit collapse and eruption have recorded the largest such changes ever measured on Earth. Scientists from across the world have been sharing their research on the historic Hawaiian eruption at the American Geophysical Union's Fall Meeting 2020, including these unprecedented findings by USGS volcanologists Michael Poland and Matthew Patrick and INGV's Daniele Carbone. At the summit, the second-largest change in continuously measured gravity was recorded over several days as the summit lava lake drained away from May 3rd to 7th, 2018. The largest continuously measured gravity change ever was recorded over a couple of hours at Puʻuʻōʻō on May 1st, 2018, corresponding to a modeled ~300 m (~1000 ft) drop in the lava level inside the crater. The values, while still only about one millionth of “normal gravity” at the Earth's surface, are of a magnitude larger than those typically observed at other volcanoes, whose underground magmatic movements shift the most mass of any natural process on the planet and register the strongest gravity change signals. The gravity measurements, combined with 3-D models of the amount of lava that drained both at the summit and Puʻuʻōʻō, allowed the researchers to calculate the density of the missing lava at either locale. At the summit, the upper ~200m (~650ft) of the lava had a calculated density that is a factor of 1.7 greater than water, at Puʻuʻōʻō of 1.9 greater, while that of a cooled basalt rock is a factor of 2.9 greater. The lava's density rose as it lost gas from the lava lake, plunged back underground and journeyed 18 km (11 miles) down the volcano’s East Rift. Once it got there, the more concentrated lava fed the Puʻuʻōʻō eruption from a lower elevation above sea level than the summit lava lake, by just the amount expected from the observed 12% density difference. Further boosting the usefulness of gravity measurements on active volcanoes, the scientists also caught one of the first signals of change on April 30, 2018, just a few minutes before the collapse of Puʻuʻōʻō. A small fissure erupted on the cone's west flank prior to its cave-in, with the gravimeter able to distinguish the opening of the “dry crack”, followed by its filling with denser lava over a few minutes. The researchers believe that as gravimeters become cheaper and easier to deploy, they could fill an important, early-warning role in the volcano monitoring toolkit. “Anyplace where magma is shallow and changes can happen quickly, it can be outstanding” said Dr. Poland, who presented the research. “It's not so great where magma is deep and changes are gradual. And I think the pre-collapse time series for Puʻuʻōʻō demonstrates that the gravity signal was much stronger and less ambiguous than the contemporary tilt signal. That might make it easier to interpret changes as they happen -- if you have a more obvious signal to look at.” While there have been similar or larger gravity changes documented on other volcanoes during periodic surveys, the record-setting measurements in this Kīlauea study were captured by continually-recording instruments that are better suited for real-time monitoring. Broader-ranging gravimetry field campaigns are also routine on the Hawaiian volcano, and when the results of their differences pre- and post-collapse are announced, Dr. Poland is confident that Kīlauea will claim the record for the largest measured change in gravity over a longer interval, too. The 2018 Kīlauea eruption remains traumatic for many island residents due to the historic nature of its destruction, with over 700 structures destroyed as well as large areas of natural and cultural resources buried by the volcano's largest eruption in 200 years. However, it has also provided scientists with an equally historic opportunity for new insights and observations, benefiting not only our island residents during future eruptions but also communities living on other volcanoes across the world. *** Image captions: 1. Halemaʻumaʻu lava lake drains as the gravity drop is on May 6, 2018, with gas bubble bursts visible on its surface as its lava continues to degas. Image credit: USGS-Hawaiian Volcano Observatory. 2. The record continuous gravity drop signals measured at Kīlauea's summit and rift zone. Image credit: Dr. Michael Poland, USGS. 3. The continuous gravity measuring instruments (gravimeters) at Kīlauea's summit (left and center) and Puʻuʻōʻō crater (right). Image credit: Dr. Michael Poland, USGS. 4. Puʻuʻōʻō cone on May 3, 2018, several days after its crater floor collapsed. The line of steam in the lower center of the image marks the trace of the initial fissure on the west flank, whose signal was detected prior to the collapse. Image credit: USGS-Hawaiian Volcano Observatory. 5. On May 8, 2018, scientists constructed a 3-D model of the Halemaʻumaʻu vent, used in this study to calculate the density of lava at Kīlauea's summit. Image credit: USGS-Hawaiian Volcano Observatory video capture. 6. A similar approach was used at Puʻuʻōʻō crater in the days after the collapse. This 3-D model of the crater on the volcano's East Rift was released on November 6, 2018. Image credit: USGS-Hawaiian Volcano Observatory video capture.